탐색적 데이터 분석(EDA)
EDA = 데이터를 분석하기 전, 그래프나 통계적 방법으로 자료를 직관적으로 바라보는 과정
- 데이터에 문제가 없는지 전체적으로 살펴보며 확인
- head나 tail 부분을 확인, 추가적인 탐색 (이상치, 결측치 등을 확인)
- 데이터의 개별 속성 값이 예측한 범위와 분포를 갖는지 확인
- 속성 간의 관계에서 개별 속성에서 발견하지 못한 패턴 발견 (상관관계, 시각화)
* 변수에 내재된 변동성(vatiation)과 변수들 간의 공변동(covariation) 파악

모델은 데이터의 패턴(= 공변동)을 추출하는 도구로, 한 변수의 값으로 다른 변수의 값을 예측/통제하거나 세부 요소들을 탐색할 수 있다

탐색적 데이터 분석 실습🔽
Titanic - Machine Learning from Disaster | Kaggle
www.kaggle.com
Titanic Tutorial with Python
Explore and run machine learning code with Kaggle Notebooks | Using data from Titanic - Machine Learning from Disaster
www.kaggle.com
캐글 타이타닉 데이터 분석 및 시각화
안녕하세요. 죠쵸입니다. 오늘부터 본격적으로 Kaggle에서 진행되었던 경진대회의 데이터를 분석해 보고 시각화를 진행해 보도록 하겠습니다. #타이타닉 머신러닝 경진대회 - Competition Overview 가
joecho.tistory.com
데이터 시각화


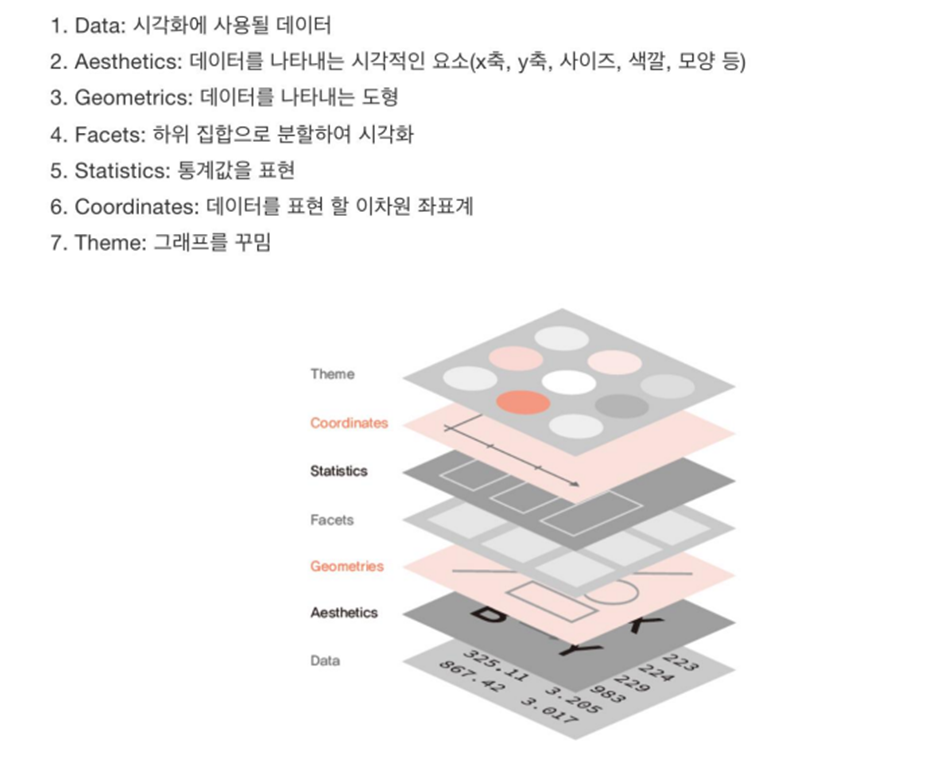
ggplot2🔽
Create Elegant Data Visualisations Using the Grammar of Graphics
A system for declaratively creating graphics, based on "The Grammar of Graphics". You provide the data, tell ggplot2 how to map variables to aesthetics, what graphical primitives to use, and it takes care of the details.
ggplot2.tidyverse.org
Shiny🔽
Shiny
shiny.rstudio.com
'Computer Science > Data Science' 카테고리의 다른 글
| [HUFS/빅데이터] #5 데이터베이스 (0) | 2022.11.07 |
|---|---|
| [HUFS/빅데이터] #4 데이터 소스, 스크레이핑 (0) | 2022.11.07 |
| [HUFS/빅데이터] #2 데이터 분석 라이브러리 소개 (0) | 2022.09.19 |
| [HUFS/빅데이터] #1 빅데이터 개론 (0) | 2022.09.05 |
| [데이터사이언스] #11 잠재 디리클레 할당 (0) | 2022.05.17 |